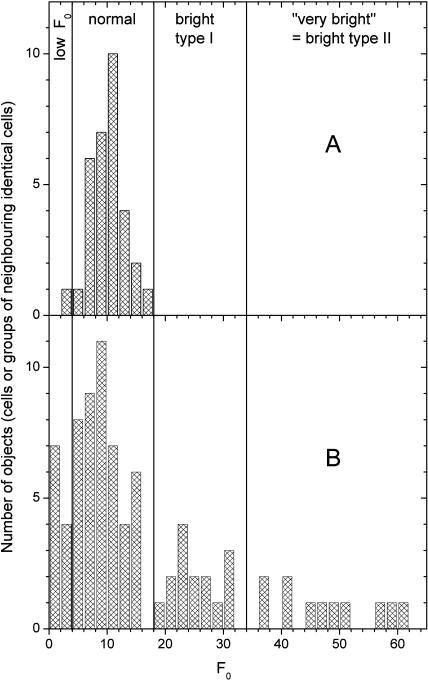
Figure 2.
Distribution of intrinsic fluorescence values in the control culture during the diazotrophic phase compared with the dark phase and early light phase. Each data point in the graphs represents one cell or one group of neighboring cells in the same trichome that was identical in all fluorescence kinetic parameters. The same cells/objects were analyzed also for all parameters shown in Figures 5, 6 (for the respective time periods as defined below), and 7 (all data). The lines separate the fluorescence states. Cells with F0 < 5 were regarded as low F0, 5 < F0 < 18 as normal, 19 < F0 < 35 as bright type I, and F0 > 35 as very bright (bright type II). A, Distribution of fluorescence values between 9:00 pm and 10:30 am, i.e. during the night and the early light phase. B, Distribution of fluorescence values between 12:30 pm and 6:30 pm, i.e. during the diazotrophic phase.

