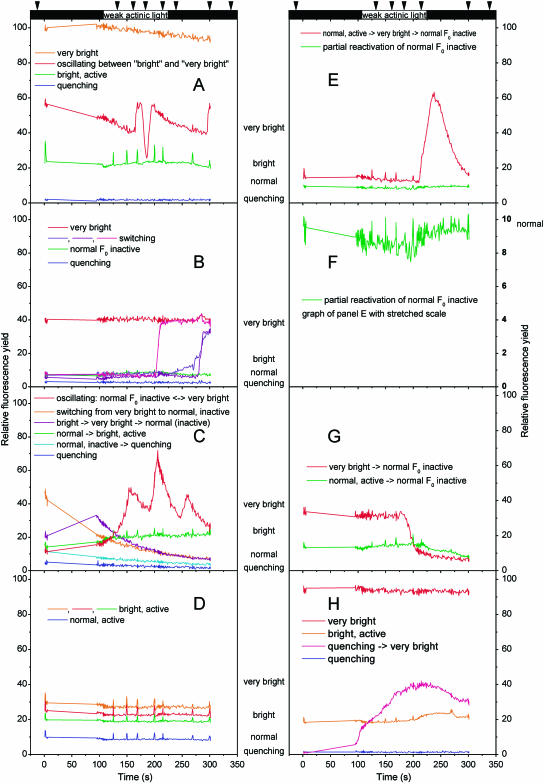
Figure 3.
FKM traces of cells that exhibited particularly interesting switches in their basic fluorescence and/or activity. The curves were recorded on samples taken from the culture during the period of nitrogen fixation. A uniform measuring protocol was applied: a 2-s saturation flash at the start followed by a 3-s measurement of relaxation, a 95-s dark period without measurement for complete relaxation of the sample in the absence of measuring light, a 5-s F0 measurement, a 100-s actinic irradiance (60 μmol m−2 s−1, 400–490 nm), and a dark period until the end of record. The arrows above the figure indicate the time points of additional 1-s saturating flashes; the black boxes indicate periods without actinic light. Note that all cells in each panel have been recorded simultaneously as a film, excluding that the drastic switches are caused by a measuring artifact. Each panel represents one example of an FKM record (two-dimensional data set = film), and each kinetic trace represents either one cell or a group of cells that displayed identical fluorescence kinetics within that FKM record. In sample A, all shown cells except bright active were on the same trichome; in the other samples, all cells were in the same trichome.

