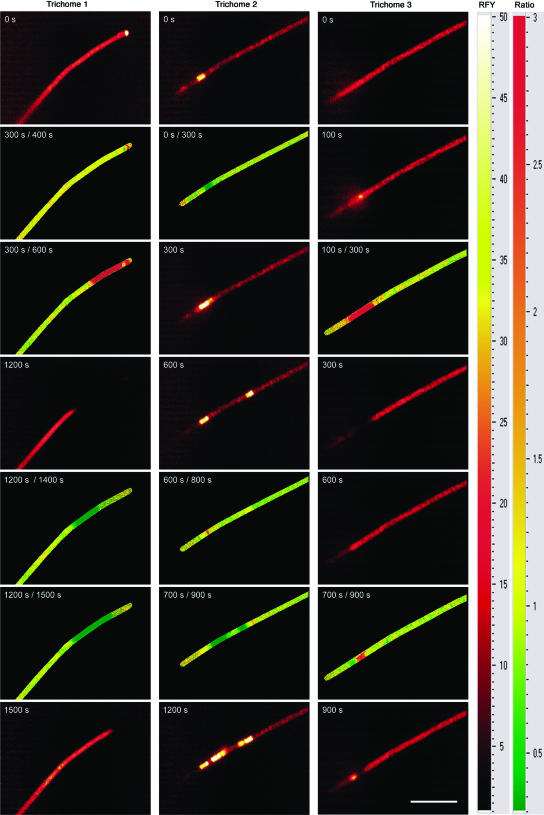
Figure 4.
FKM parameter images showing the spatial and temporal distribution of reversible switches between different fluorescence states. The data were recorded under measuring light during the period of nitrogen fixation. The images in the glow color scale show the actual fluorescence yield (white = high → yellow → red → black = low fluorescence yield). The images in red-yellow-green color scale show changes in fluorescence yield as a ratio of the first divided by the second image (red = decrease, yellow = constant, green = increase; areas without cells are labeled black). The scale bar in the lower right image represents 50 μm.

