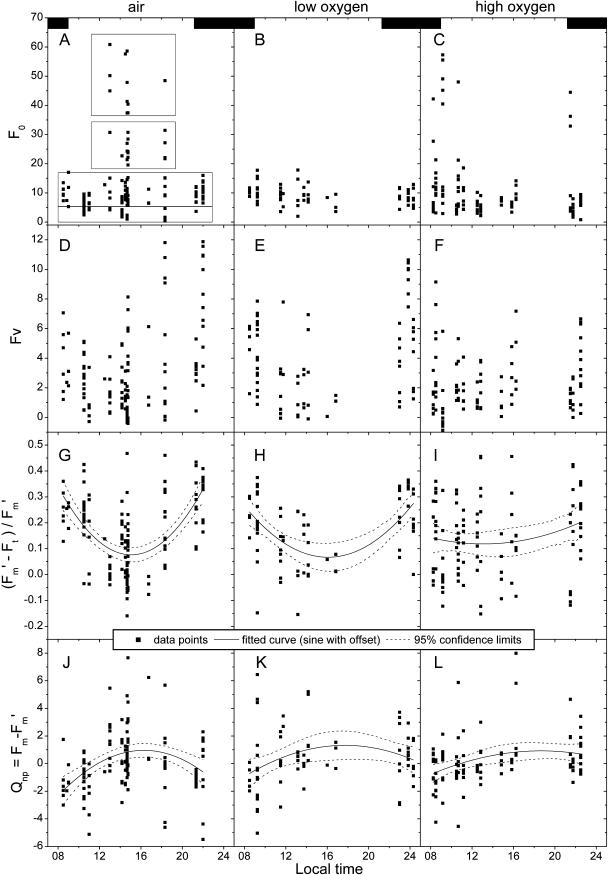
Figure 6.
Diurnal cycle of photosynthetic activity and influence of variations in oxygen concentration. As in Figures 2 and 5, each data point in the graphs represents one cell or one group of neighboring cells in the same trichome that was identical in all fluorescence kinetic parameters. Usually several data points were recorded at the same time because several cells were selected in the same two-dimensional measurement (film) and several films were recorded from the same cell preparation. The kinetic records of the same cells/objects were analyzed not only for all panels within one column of this figure, but also for all parameters shown in Figures 2, 5, and 7. The dashed boxes in A indicate the classification of the physiological states correlating to F0. The black boxes in the first row of graphs indicate the dark period (9 pm–9 am). All data were measured at an actinic irradiance of 60 μmol m−2 s−1 blue (400–490 nm) light. The parameter (F′m − F′t)/F′m is mainly shown for comparison with previous studies; because of the variations in F0 studied here, it cannot be used in its conventional sense, i.e. as a measure of PSII efficiency. For the latter, the non-normalized parameters should be used instead. First row, F0; second row, Fv; third row, (F′m − Ft)/F′m; fourth row, Qnp = Fm − F′m. Left column, Control (air); middle column, 5% oxygen; right column, 50% oxygen.

