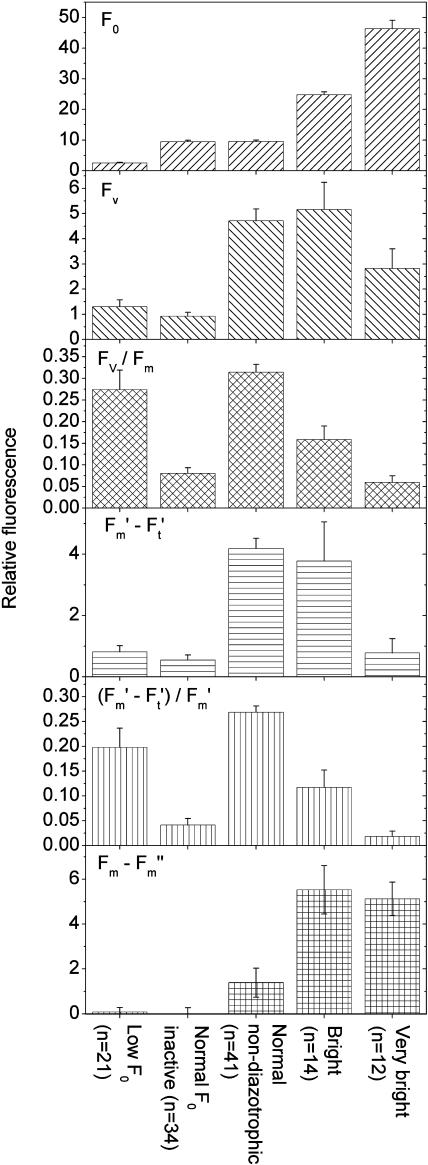
Figure 7.
Fluorescence kinetic parameters of the different physiological states of Trichodesmium cells. All data were taken from the control culture and measured at an actinic irradiance of 60 μmol m−2 s−1 blue (400–490 nm) light. The definition of the groups by the level of basic fluorescence was used as shown in Figures 2, 5, and 6, i.e. cells with F0 < 5 were regarded as low F0 (quenching), 5 < F0 < 18 as normal, 19 < F0 < 35 as bright type I, and F0 > 35 as very bright (bright type II). The group normal non-diazotrophic refers to all cells with normal fluorescence measured between 12:00 am to 10:30 am and between 9:00 pm to 12:00 am, and was defined this way to exclude those cells that had normal F0 but occurred during the photosynthetically inactive recovery phase after nitrogen fixation. The group normal F0 inactive includes all cells with normal F0 (see above) with an Fv/Fm lower than the average of the normal non-diazotrophic group and measured during the diazotrophic period. As in Figure 2, the parameters (F′m − F′t)/F′m and Fv/Fm are mainly shown for comparison with previous studies; because of the variations in F0 studied here, they cannot be used in their conventional sense, i.e. as a measure of PSII efficiency. For the latter, the non-normalized parameters should be used instead. The number of samples (n) refers to the number of objects within the group. As in all other figures, each object represents a cell or a group of neighboring cells that was identical in fluorescence kinetics; the objects shown here are the same as shown in Figures 2, 5, and 6. All groups were highly significantly (t tests, P < 0.01) different for all tested parameters (F0, Fv, Fv/Fm, F′m − F′t, (F′m − F′t)/F′m, Fm − F′m), except for the following t tests (Q, quenching; NI, normal F0 inactive; NA, normal non-diazotrophic; B, bright type I; V, very bright [bright type II]): (1) F0 was not significantly different between NI and NA (P = 0.96). (2) Fv was not significantly different between Q and NI (P = 0.20) and between NA and B (P = 0.66). (3) Fv/Fm was not significantly different between Q and NA (P = 0.33), between Q and B (P = 0.07), and between NI and V (P = 0.38). (4) F′m − F′t was not significantly different between NI and V (P = 0.55), between Q and NI (P = 0.31), between Q and V (P = 0.94), and between NA and B (P = 0.66). (5) (F′m − F′t)/F′m was not significantly different between Q and B (P = 0.17) and between NI and V (P = 0.25). (6) Qnp = Fm − F′m was not significantly different between Q and NI (P = 0.80), between Q and NA (P = 0.16), and between B and V (P = 0.77). (7) The P value of the differences in Fv was 0.03 for Q versus V, and 0.05 for NA versus V and B versus V. The P value of the difference in Fv/Fm was 0.01 for B versus V. The P value of the F′m − F′t comparison was 0.04 for B versus V. The P value of the difference in Qnp = Fm − F′m was 0.07 for NI versus NA. The P value of the difference in (F′m − F′t)/F′m was 0.03 for NI versus B and 0.02 for B versus V.

