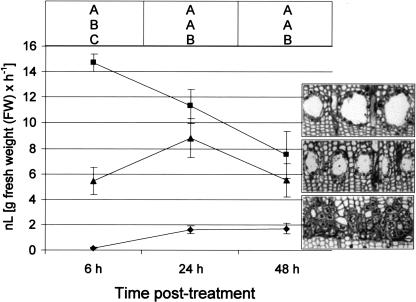
Figure 5.
Ethylene biosynthesis in Douglas fir stems at different times following wounding or 100 mm MJ treatment. Samples were collected at 6, 24, and 48 h. Means of three replicates ± se are indicated. Data are for MJ-treated internode (▪), internode above MJ treatment (▴), and wounded internode (♦). Ethylene was detected at the internode above the wound, although it was below the quantifiable limits of the calibration curve and, thus, is not shown on this scale. Ethylene was not detected after Tween 20 control treatments. Images to the right of each curve are representative of the appearance of the new sapwood 4 weeks after treatment. Different letters indicate significant differences (P < 0.05) between treatments at each time point.

