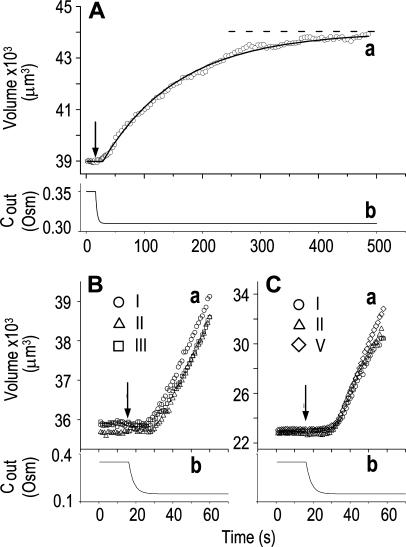
Figure 1.
The osmometer properties of swelling protoplasts. A, a, An approximately 8-min-long time course of swelling of a BMS (“Materials and Methods”) protoplast exposed to a change of the bath solution from 350 mOsm to 310 mOsm. Symbols, Experimental values of protoplast volume calculated from the areas of its circular two-dimensional-projection images (initial diameter: 42.1 μm). Line, Protoplast volume calculated using Eq. 2f (Supplemental Appendix I, with Pf = 9.6 μm s−1). A 12.6-s delay relative to the onset of solution exchange has been introduced into the calculation to allow a satisfactory fit of the line to the data. The predicted volume increase was 12.9%, and the observed increase was 12.6%. A, b, Cout during the osmotic challenge, calculated using Eqs. 1a–1d (Supplemental Appendix I, with the following values: twidth = 2.5 s, thalf = −33.1 s,  ,
,  , and
, and  ). B, a, An approximately 60-s-long time course of swelling of a BMS protoplast (initial diameter: 40.9 μm) exposed to alternating bath solutions: first to 354 mOsm (isotonic), then to 160 mOsm (hypotonic), then again to 354 mOsm, etc. (only the steady-state volume attained upon the returns to the isotonic solutions is shown, not the time course of shrinking). The Roman numerals denote the order of recorded volume increases corresponding to the order of the hypotonic challenges. Fitting the data, as in A, a, yielded Pf = 7.0 ± 0.1 μm s−1 (mean ± se, n = 3) and delay = 12.2 ± 0.5 s. B, b, The corresponding calculated Cout time course during the swelling episode (Eqs. 1a–1d, with parameter values as in A, b). C, a, A 35.1-μm (diameter) protoplast undergoing similar hypotonic changes as in B. Fitting the data, as in A, a, yielded Pf = 36.2 ± 3.7 μm s−1 (n = 5) and delay = 15.3 ± 1.3 s. C, b, Cout as in A, b. See “Materials and Methods” and Supplemental Appendices I and II for details of calculations and fitting.

