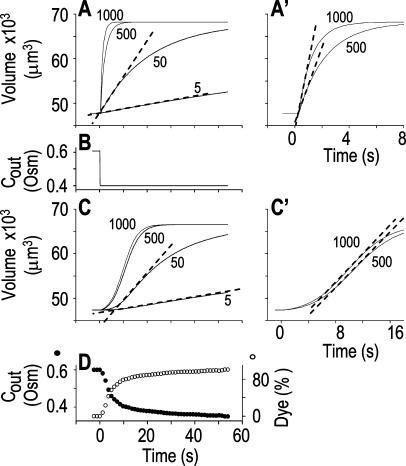
Figure 2.
The resolution limits of estimating  manually. A simulation of a 60-s-long time course of swelling of a 22.5-μm (diameter) protoplast (A, A′, C, C′), exposed to a change of the bath solution, Cout, from isotonic (0.6 Osm) to hypotonic (0.4 Osm), during a step exchange (B) and during gradual solution exchange (D). Numbers indicate the values of the initial osmotic water permeability of the membrane,
  (in μm s−1), used in the simulation of volume changes. The dashed straight lines have been fitted manually (by eye-balling) to the initial, or fastest-rising, part of the curve. The
  values determined from the slopes of these straight lines using Eq. 2b are listed in Table I. A, A simulation of volume changes (Eq. 2d) based on an instantaneous change of external concentration, as in B. A′, The first 8 s of A, on an expanded time scale. C, A simulation based on a gradually changing external concentration, as in D (Eqs. 1b and 2d). C′, Fragment of C, on an expanded scale. Note the apparent delay in the volume change, ignored in the manual fitting of the initial volume increase. D, The simulated changing osmolarity of the bath solution (Cout, full circles, Eq. 1b, with parameter values as in Fig. 1A, b), calculated from the time course of fluorescence (in relative units) of dilute acridine orange in the incoming solution (Dye, open circles, Eq. 1a). See text and “Materials and Methods” and Supplemental Appendices I and II for the simulations details.

