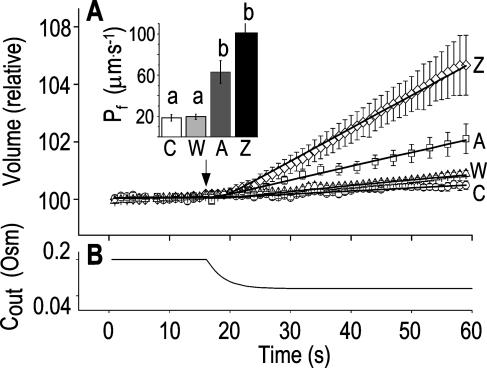
Figure 3.
“Non-classical” determination of best-fit  of oocytes. A, A 60-s-long average time course of swelling of Xenopus oocytes exposed to a change of solutions from 170 to 50 mOsm. Symbols, Volumes (normalized to the baseline volume) determined from control, noninjected oocytes (C; n = 16), water-injected oocytes (W; n = 8), oocytes pretreated with 100 μg/mL amphotericin-B during 10 to 60 min (A; n = 23), and oocytes injected with 50 ng mRNA of the ZmPIP2;5 (Z; n = 10). Lines, Simulations of swelling, calculated using model 5 (Eq. 2d), and the mean best-fit values of parameters obtained by fitting each individual cell's volume increase with this model. Note that the values of
  and delay in all cases were indistinguishable from zero. Inset, The means (±se) of the individual best-fit values of
  obtained in the various treatments (denoted by letters as in A). B, Cout during the hypotonic challenge, recontructed using Eq. 1d (with parameter values as in Fig. 1A, b).

