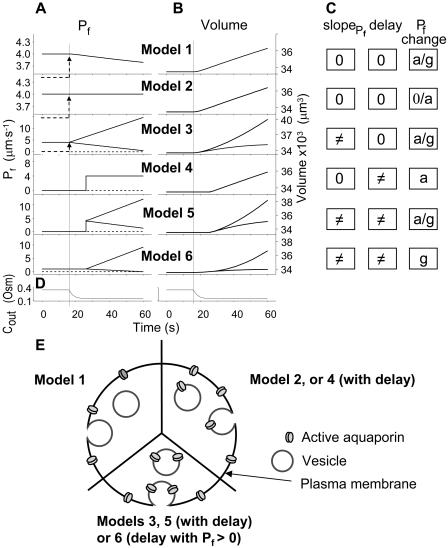
Figure 4.
Models of volume changes upon hypotonic challenges. A, Simulated time course of Pf. Horizontal dashed lines mark null water permeability. Up arrows mark step increase of Pf (an alternative Pf time course, pending on Pf having a zero value prior to the hypotonic challenge). Vertical lines mark the start of bath perfusion. B, Simulated time course of cell volume. Vertical lines as in A. C, A summary of the essential components of the models:  (absent: 0, or present: ≠), delay (similarly),
  change relative to preceding Pf (gradual, g; abrupt, a; absent, 0). D, Simulated time courses of bath osmolarity, Eq. 1b to 1d (with parameter values as in Fig. 1A, b). All simulations employed Eqs. 1b to 1d and 3. Additional equations (all from Supplemental Appendix I) were used as follows: model 1: Eqs. 2d and 4 to 5,
  ; model 2: Eq. 2d,
  ; model 3: Eqs. 2e and 6,
  ,
,  , and
, and  , for the upper and lower lines, respectively; model 4: Eqs. 2f and 7;
  , delay = td = 10 s; model 5: Eqs. 6, 7, and 2g; all parameter values as in models 3 and 4 combined; model 6: Pf during the delay =
  ,
,  , and
, and  , for the upper and lower lines, respectively. E, A schematic illustration of some of the modeled vesicular mechanisms of Pf dynamics during the cell swelling phase (not all the options are included). See text for further explanations.

