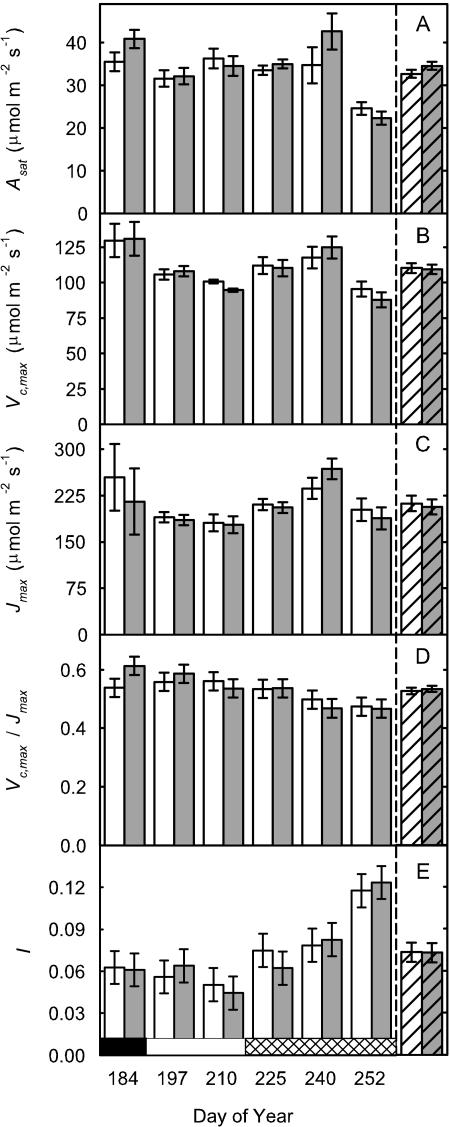
Figure 3.
Photosynthetic parameters from the topmost fully expanded trifoliate from soybean grown in current (62 nL L−1 8-h daily average; white bar) or elevated (approximately 1.2× current; gray bars) [O3] over the growing season. Parameters are Asat (A), Vc,max (B), Jmax (C), Vc,max/Jmax (D), and l (which was calculated as percentage difference between potential photosynthesis at growth [CO2] and actual photosynthesis; E). Season averages are reported as the striped pair of bars at right of each figure. Each bar is the least squared mean (n = 4), and the error bars are ± the se of the difference in least square means. Significant differences (P value ≤ 0.05) are starred. Developmental stages are represented by the horizontal bar: vegetative (black), flowering (white), and pod filling (cross-hatched).

