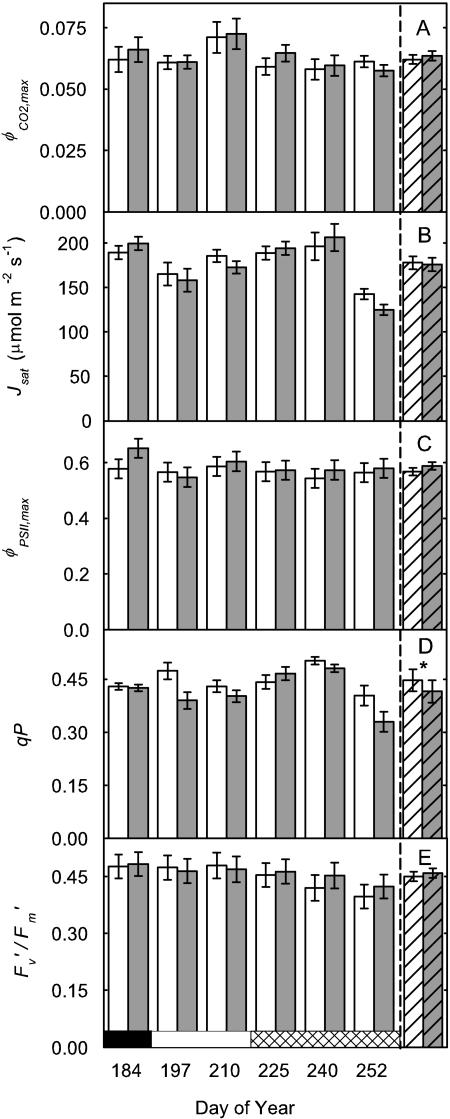
Figure 4.
Electron transport and fluorescence parameters of the leaves described in Figure 3. Parameters are φCO2,max (calculated as the initial slope of the photosynthetic carbon assimilation response to light; A), Jsat (B), φPSII,max,l (C), qP (D), and  /
/ at 2,000 μmol m−2 s−1 (E). All parameters were calculated from fluorescence measurements of electron transport rates in increasing light. Data presented as in Figure 3.

