Figure 5.
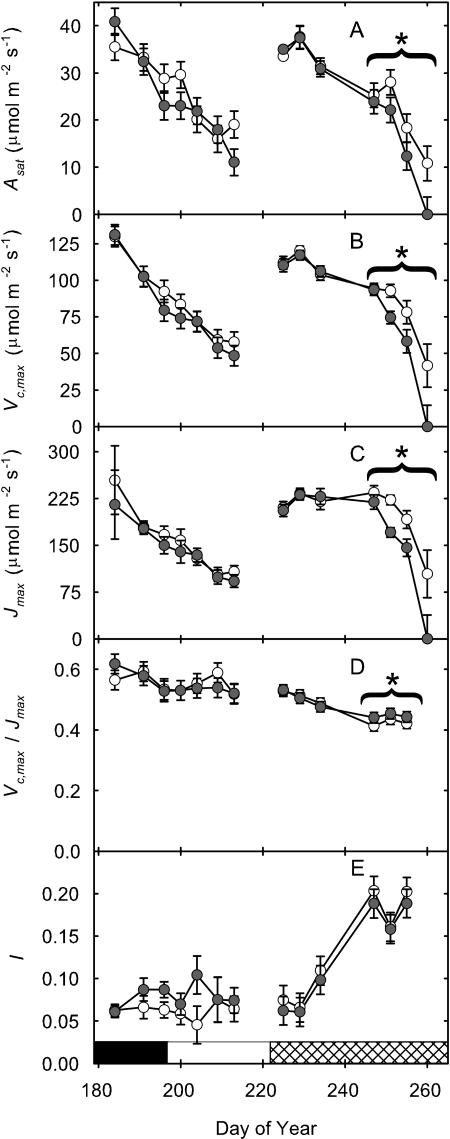
Photosynthetic parameters of two leaf cohorts grown in current (62 nL L−1 8-h daily average; white symbol) or elevated (approximately 1.2×; gray symbol) [O3] over the growing season. The first cohort was initiated in the vegetative phase of growth (V5), the second during flowering (R4) and persisted to late pod filling (R7). Parameters are Asat (A), Vc,max (B), Jmax (C), Vc,max/Jmax (D), and l (E). Each point is the mean (n = 4), and the error bars are ± the se of the difference in least square means. Significant linear contrasts over the last 3 or 4 d are noted with a starred bracket. Values of 0 indicate the absence of leaves at that time point. Vegetative (black), flowering (white), and pod-filling (cross-hatched) developmental stages are represented by the horizontal bar.

