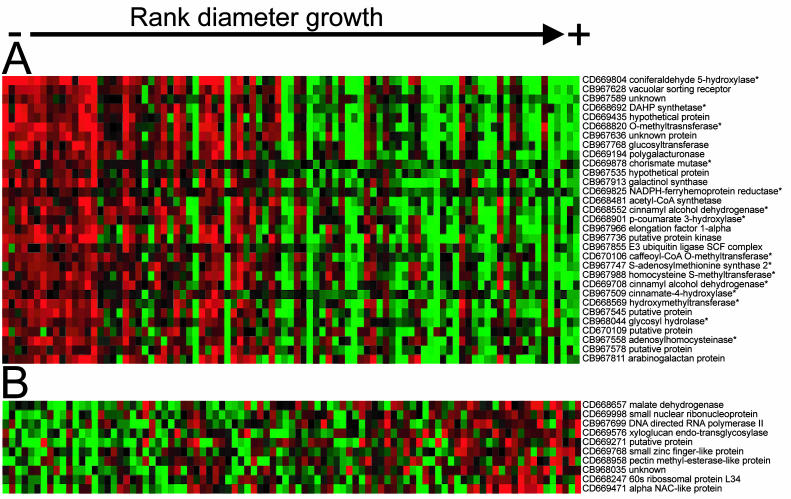
Figure 2.
Association between gene expression and diameter variation. The E. grandis backcross progeny is ranked according to diameter (x axis) and negative (A) or positive (B) correlation between relative transcript level and diameter variation (y axis). Least square means estimates of transcript levels were normalized relative to the mean of each gene across the population. Red represents higher and green represents lower expression relative to the other individuals of the population, for each specific gene. Black indicates no change in mRNA levels. GenBank accession numbers and putative functions are displayed on the right. Genes represented by multiple cDNAs are represented by the most highly correlated, and those related to lignin biosynthesis are indicated by asterisks.

