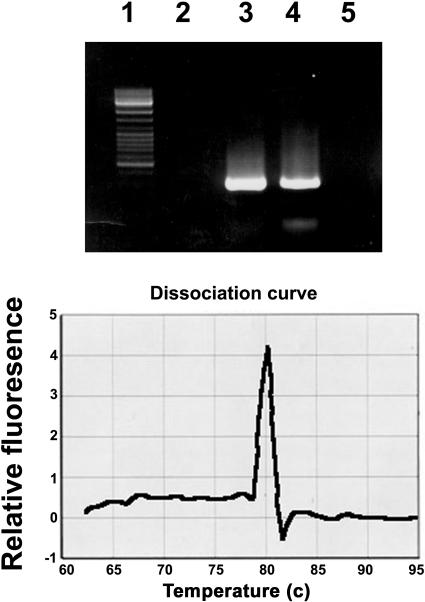
Figure 1.
Top, Electrophoretic pattern of the product amplified by RT-PCR with primers derived from the 3′ variable region of the N gene. Primer sequences are shown in “Materials and Methods.” RNA templates served for RT-PCR were extracted from tobacco. Lane 1, Size markers. Lane 2, Noninfected tobacconn. Lane 3, Noninfected tobaccoNN. Lane 4, A noninfected systemic leaf of tobaccoNN, locally infected with TMV. Lane 5, A TMV-infected systemic leaf of tobacconn. Bottom, Temperature dissociation curve of the band shown in lane 3 of the top frame.

