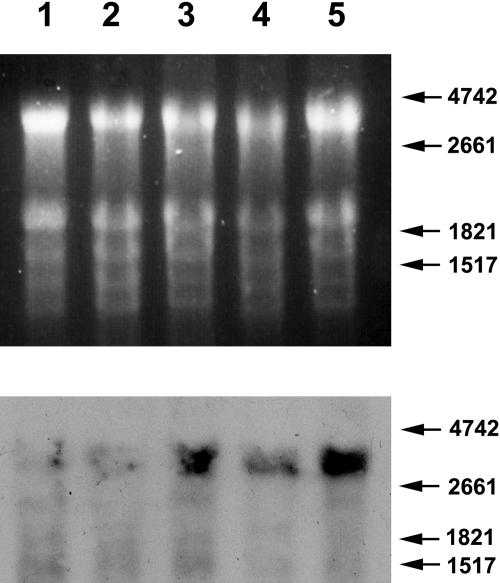
Figure 3.
Northern analysis of N-gene expression. Top, Ethidium bromide-stained gel pattern. Bottom, Pattern of fluorescent bands following hybridization of the gel shown in the top frame to the DIG-labeled PCR product shown in Figure 1. Numbers and arrows on the right indicate the positions of RNA size markers. Lanes were loaded with RNA extracted of a leaf from non-inoculated tobacconn (lane 1), a leaf from TMV-infected tobacconn (lane 2), a locally infected leaf of tobaccoNN (lane 3), a leaf from noninoculated tobaccoNN (lane 4), and a systemic (noninfected) leaf from TMV-infected tobaccoNN (lane 5).

