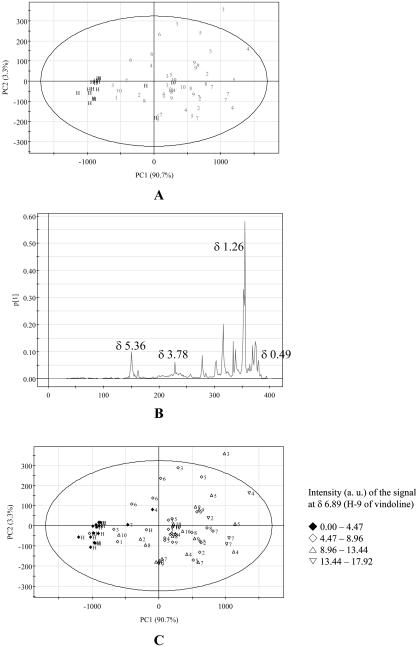
Figure 7.
Score and loading plot of PCA of the CHCl3 extracts of healthy and phytoplasma-infected C. roseus leaves. A, score plot; B, loading plot of PC1; C, score plot with the intensity of H-9 of vindoline in 1H-NMR spectra. 1, AP; 2, BLL; 3, DYON; 4, MOL; 5, PPT; 6, SMBB; 7, STOF; 8, STOL; 9, TBB; 10, UDINESE; H, healthy. The ellipse represents the Hotelling T2 with 95% confidence in score plots.

