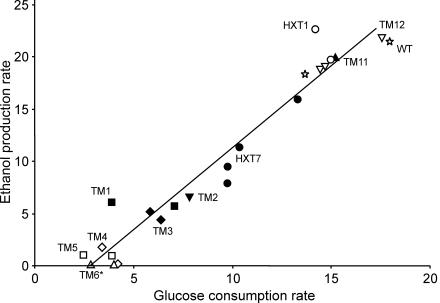
FIG. 3.
Plot of the maximal specific ethanol production rate (expressed as millimoles of ethanol per gram [dry weight] per hour) versus the maximal specific glucose consumption rate (expressed as millimoles of glucose per gram [dry weight] per hour) of independent batches for the wild-type (WT) (open star), HXT1 (open circles), HXT7 (solid circles), TM1 (solid squares), TM2 (solid inverted triangles), TM3 (solid diamonds), TM4 (open diamonds), TM5 (open squares), TM6* (open triangles), TM11 (solid triangles), and TM12 (open inverted triangles) strains. All data were obtained during the maximal production period in the respirofermentative phase for all strains except the TM6* strain (which displays only a single phase).

