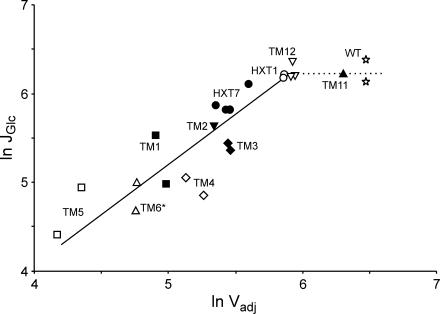
FIG. 5.
Double-logarithmic plot of glycolytic flux, JGlc (maximum specific glucose consumption rate, expressed as nanomoles of glucose per milligram of protein per minute) versus adjusted glucose transport activity, Vadj (expressed as nanomoles per milligram of protein per minute). The protein content was assumed to be 0.5 g (g [dry weight])−1, and the intracellular glucose concentration was assumed to be 0 mM. For strain and symbol explanations, see the legend to Fig. 3. Values for all strains except the TM6* strain (which displays only a single phase) were calculated during the respirofermentative phase.

