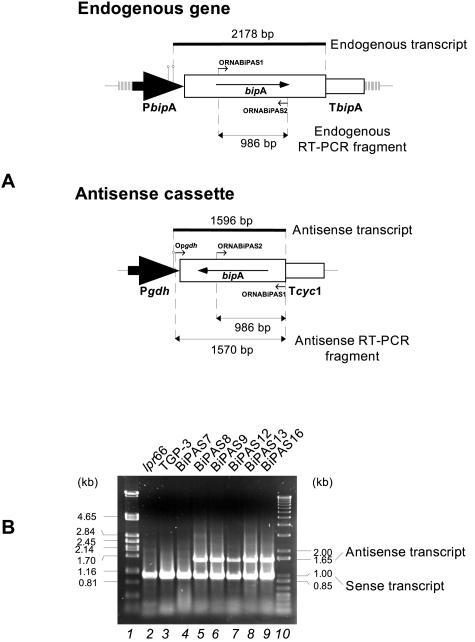
FIG. 7.
RT-PCR analysis of bipA transcripts in transformants containing the antisense construction. (A) Diagram of the hybridizing fragments from both endogenous and antisense bipA transcripts used in Northern blot analysis (thick lines) and RT-PCR products expected in both cases (thin lines with an arrowhead at each end). The large black arrows represent promoters, and the open boxes with an arrow inside represent bipA sense and antisense genes. The empty open boxes represent terminators. The lollipop symbols indicate transcription start points. The primers used are represented by small arrows. (B) RT-PCR products from mRNA of the lpr66 and TGP-3 control strains (lanes 2 and 3) and antisense transformants (lanes 4 to 9). Lanes 1 and 10 contained size markers (λ PstI and 100-bp ladder). Oligonucleotides ORNABiPAS1, ORNABiPAS2, and Opgdh were used as the primers. The 1,570-bp band corresponds to the bipA sense transcript, and the 986-bp band corresponds to the bipA antisense mRNA.

