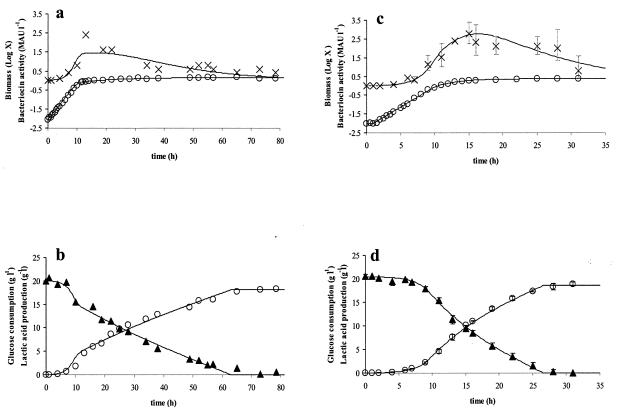
FIG. 1.
Modeling of biomass (in grams of CDM per liter (○) and bacteriocin production (in MAU per liter) ×) (a and c) and of glucose consumption (in grams of glucose per liter) (▴) and lactic acid formation (in grams of lactic acid per liter) (○) (b and d) for L. curvatus LTH 1174 in the control fermentation in standard MRS medium (a and b) and in MRS medium with twice the amount of the complex nutrient source (c and d) at a controlled temperature of 25°C and a constant pH of 5.5. The symbols represent experimental values; lines are drawn according to the model. For the fermentation with twice the concentration of complex nutrient source, the values are the averages of three fermentations, and the error bars represent the standard deviations.

