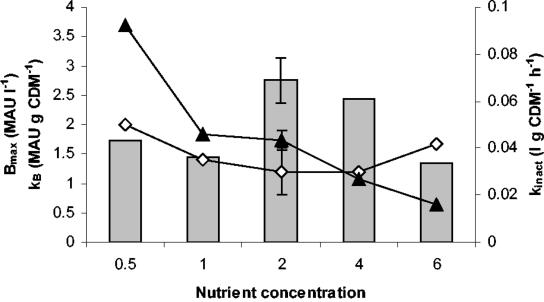
FIG. 3.
Influence of complex nutrient source concentration on maximum attainable bacteriocin activity (bars), specific bacteriocin production (▴), and bacteriocin inactivation rate (⋄). The values for the fermentation with twice the amount of complex nutrient source are the averages of three experiments for which the error bars represent the standard deviations.

