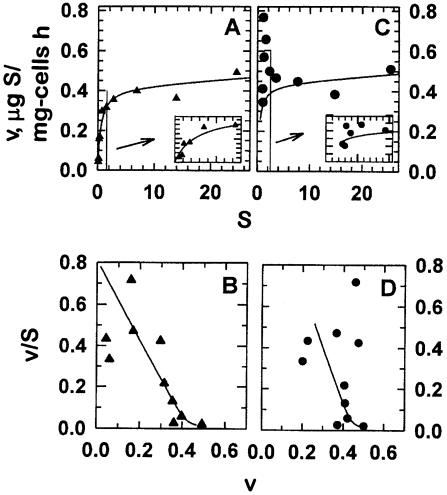
FIG. 2.
Monod (A and C) and affinity (B and D) plots of leucine uptake from Resurrection Bay, Alaska, seawater at a 10-m depth in Thumb Cove during June. Panels A and B show apparent rates from the specific activity of the [3H]leucine added; panels C and D show rates corrected for an ambient leucine concentration ([Sn]) of 0.85 μg/liter. Insets expand data near the origin. Both rates were corrected for an incorporation-to-uptake ratio of cell yields (Y) using a value of 0.45 from 14CO2 liberation and 3H incorporation rate data. When fit to the equation v = Vm[S]/(Ka + [S]) + kind[S], the parameters for observed (A and B) and Sn-corrected (C and D) rates (Vm) were 0.42 and 0.50 μg of leucine mg of cells−1 h−1, and kind was 0.002 and 0.003 liters g of cells−1 h−1. The affinity constants (Ka) obtained from [S] at the half-maximal value of v/[S] and the rate v (the affinity plot abscissa) were 1.5 and 1.9 μg/liter from panels B and D, respectively.

