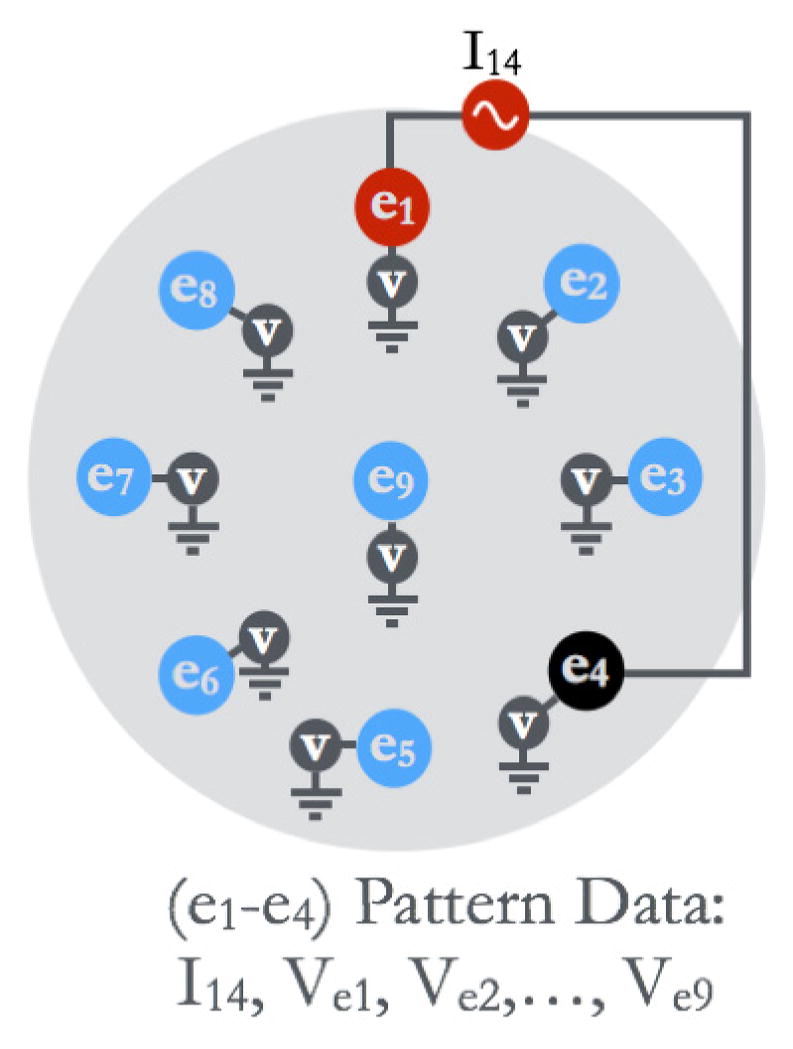
Fig. 2.

An illustration of data collection in EIA for a single ‘pattern’. Electrode 1 (e1) and electrode 4 (e4) were used to apply the current signal, and the induced electric potential was measured at all electrodes. The data corresponding to the (e1–e4) pattern consists of current measurement (I14), and measured voltage at all electrodes.
