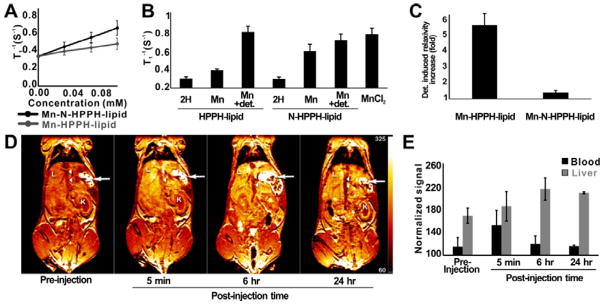
Figure 4.
MR contrast with Mn-N-HPPH liposomes. A) T1 relaxivity for indicated PoP liposomes. B) T1 rates for PoP liposomes at 0.1 mM PoP. TX-100 detergent (“+ det.”) lysed the liposomes. C) Detergent-induced relaxivity enhancement of PoP liposomes. D) Representative T1-weighted MRI of a BALB/c mouse IV injected with Mn-N-HPPH liposomes. Immediate and sustained signal enhancement was seen in the liver (L) for up to 24 hr, while enhancement in the inferior vena cava (arrow heads) peaked immediately after injection but returned to baseline. Stomach (arrows) and kidneys (K) are labelled for anatomical reference. Scale is arbitrary units following signal normalization by phantoms. E) MR signal in blood and liver of mouse. In vitro experiments used 1:1 PoP:DMPC and in vivo experiments used [5:45:50] [DSPE-PEG2K:N-HPPH-lipid:DMPC]. Data show mean ± SD, n=3.

