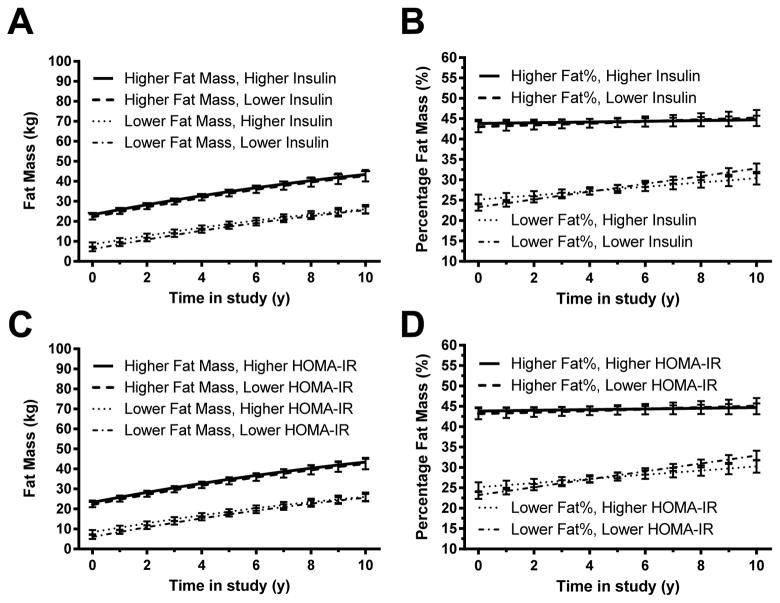
Figure 3. Changes in Fat Mass – full cohort.
Associations between baseline fasting insulin and gain in (A) fat mass and (B) percentage body fat mass. Associations between homeostasis model assessment for insulin resistance (HOMA-IR) index and gain in (C) fat mass, and (D) percentage body fat mass. In each analysis, those with higher baseline insulin or HOMA-IR (represented graphically using the 75th percentile) did not gain significantly more body fatness over time, independent of baseline fat and other covariates, than those with lower baseline insulin or HOMA-IR (represented graphically using the 25th percentile; see Subjects and Methods). However, baseline body fat mass and percentage body fat mass were significant positive predictors of later body fatness (p<.001 in each analysis).

