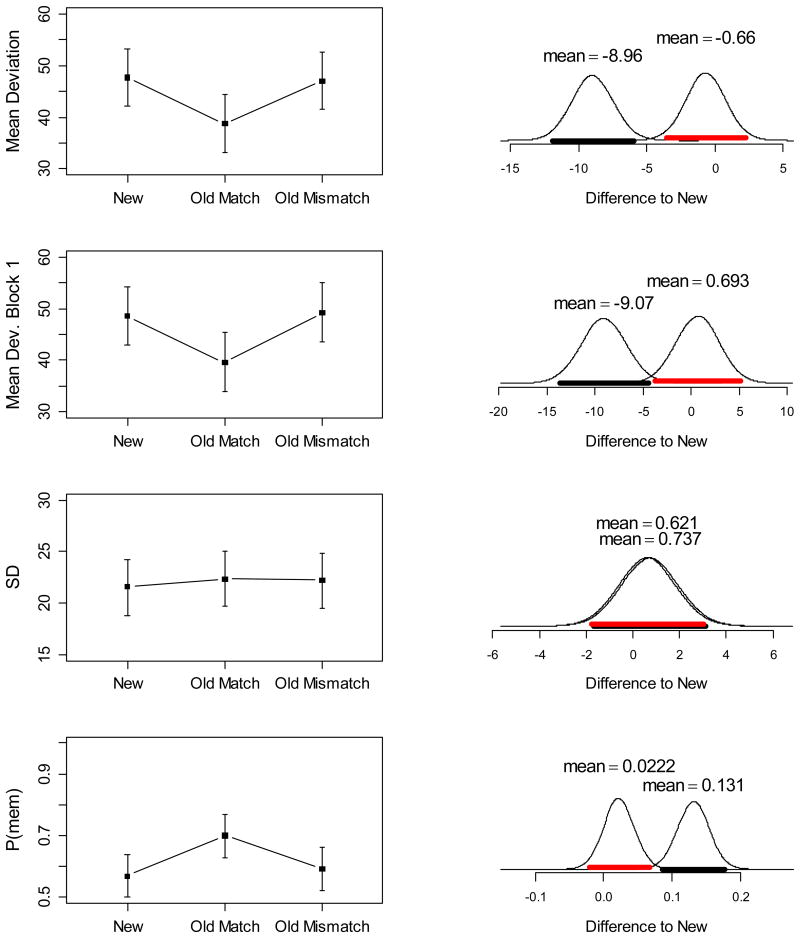
Figure 4.
Left: Condition means of dependent variables from the WM test of Experiment 2; error bars cover the 95% highest-density interval computed from the ANOVA model including the main effect of condition (Kruschke, 2011). Right: Posterior densities of pairwise differences of the old-match condition (black) and the old-mismatch condition (red) relative to the new condition. The thick black bar covers the 95% highest-density interval of the posterior difference.

