
Fig. 3.
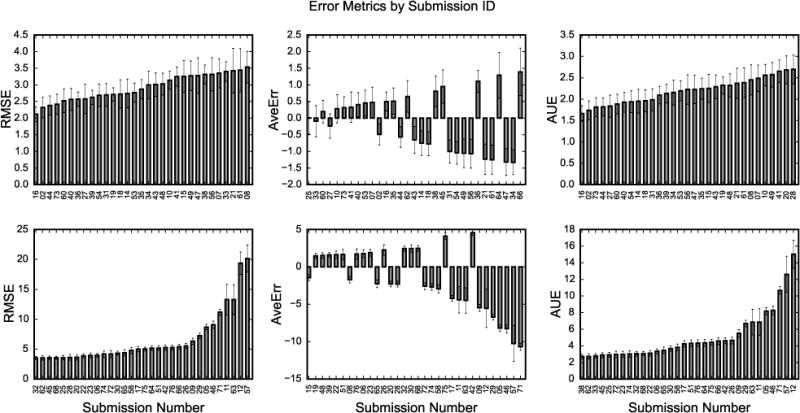
Root-mean-squared error (RMSE), average error (AveErr), and average unsigned error (AUE) for every SAMPL5 submission covering all batches. The submissions on each plot are sorted from best to worst by that metric. Due to the number of submissions, data was split across the two panels, with a change in the y-axis scale.