
Fig. 2.
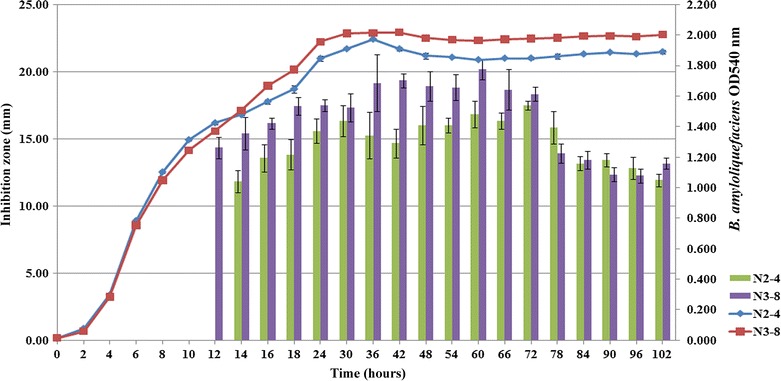
The production of secondary metabolites from B. amyloliquefaciens N2-4 and N3-8 isolates. The production of secondary metabolites displayed as sizes of the inhibition zones in nm against B. pseudomallei as evaluated by the agar well diffusion method from N2-4 (green bars) and N3-8 (purple bars) were plotted on the left Y axis and growth curve as measured at OD540 nm of N2-4 (blue line) and N3-8 (red line) were plotted on the right Y axis, while X axis represent the time in hours