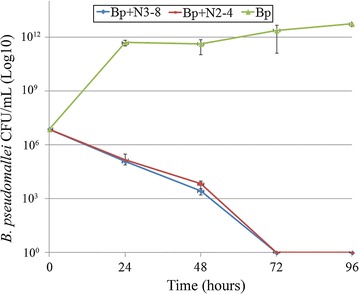
Fig. 5.

Bio-control by co-culture B. pseudomallei with B. amyloliquefaciens. The colony count of B. pseudomallei was plotted on the Y axis and time in hours on the X axis after co-culture with B. amyloliquefaciens isolates N2-4 (red line) and N3-8 (blue line) and the green line indicates the growth of un-treated B. pseudomallei as a control
