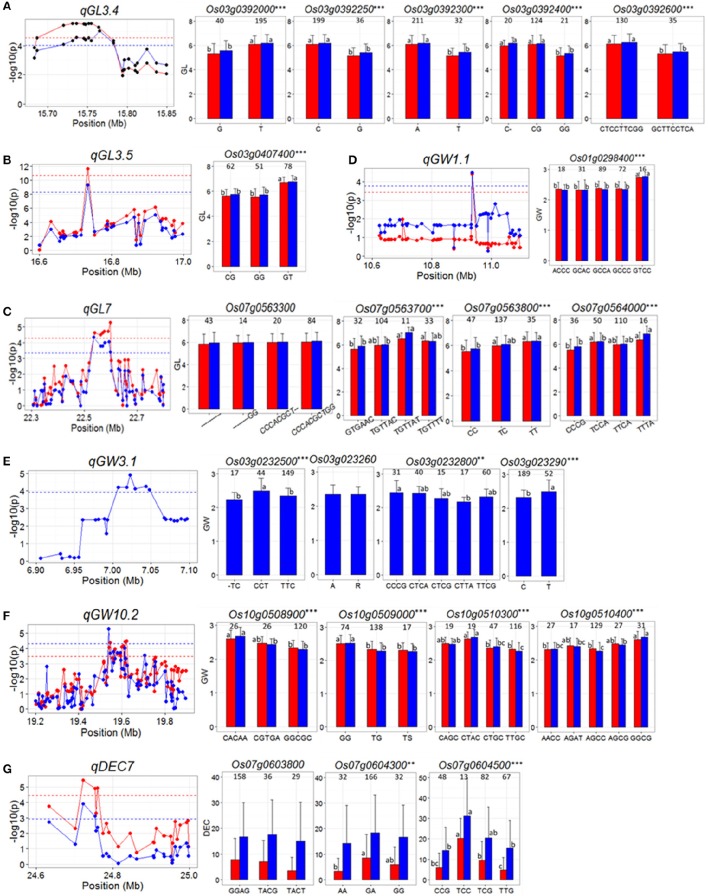
Figure 3.
(A–G) Gene-based association analysis of seven important QTL loci and haplotypes analysis of targeted genes of related QTL including qGL3.4 (A), qGL3.5 (B) qGL7 (C), qGW1.1 (D), qGW3.1 (E), qGW10.2 (F), and qDEC7 (G). Each point was a gene indicated by one of its SNPs having largest LD (r2) value with the peak SNP of the QTL. Dash line showed the threshold to determine significant SNP. The ** and *** suggested significance of ANOVA at p < 0.01 and p < 0.001, respectively. The letter on histogram (a, b, and c) indicated multiple comparisons result at the significant level 0.01. The value on the histogram was the number of individuals of each haplotype. Red and blue color indicated SY and SZ environments, respectively.

