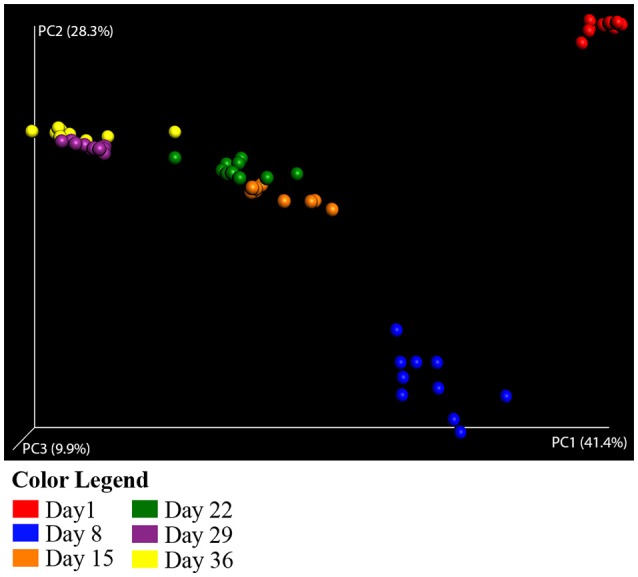
Figure 1.

Principal coordinate analysis of weighted UniFrac distances for Aviary Study 1. Principal coordinate analysis (PCoA) plots each sample as a point in multidimensional space based on the composition of the bacterial population in each sample. Closeness of two points in the PCoA denotes similar bacterial population composition between the samples. The halo around each point depicts the variation in point location observed in 3 dimensional space after jackknife resampling at the specified rarefaction level. Samples are colored by age of the duck throughout the grow out period—Red, Day 1; Blue, Day 8; Orange, Day 15; Green, Day 22; Purple, Day 29; Yellow, Day 36. Analyses were conducted on data rarefied to 10,000 sequencing reads. Axes are scaled by the percent of variation explained by each principal coordinate. Individual ceacal samples from ducks of the same age form distinct clusters. Halos from statistical resampling are not visible at this scale, an indication of the significance of the separation shown between points.
