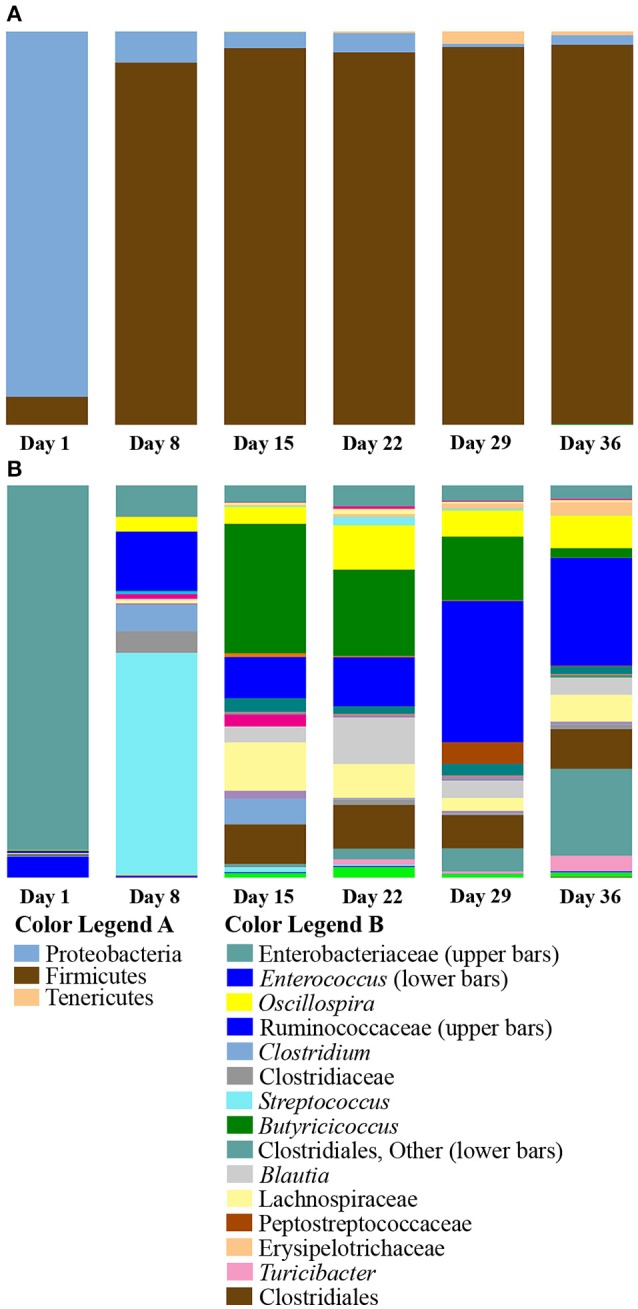
Figure 2.

Summary of bacterial taxa observed by age of duck in Aviary Study 1. The relative abundances of bacterial 97% operational taxonomic units (OTUs) are shown for duck caecal samples grouped according to age of the duck. (A) Depicts phylum level classifications for observed OTUs. OTUs representing smaller proportions of the population are listed in Supplementary Table 5, Taxa Summary Legends. (B) Depicts genus level (or higher) classifications for observed OTUs for samples grouped according to the age of the duck. Full color legends for each panel are listed in Supplementary Table 5, Taxa Summary Legends. A major shift from Day 1 to Day 8 occurs at the phylum level. There are clear differences in abundance of particular OTUs from Day 8 through Day 36.
