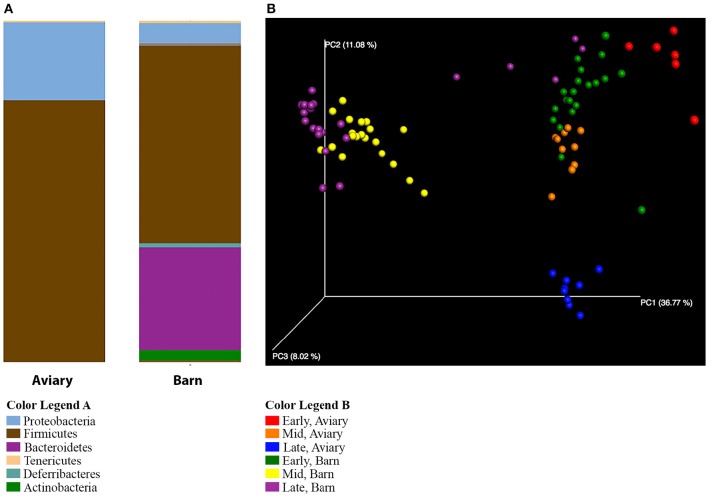
Figure 4.
Comparison of aviary and barn studies. (A) The relative abundances of bacterial 97% operational taxonomic units (OTUs) are shown for all duck caecal samples from aviary and barn environments at the phylum level of classification. Full color legends for each panel are listed in Supplementary Table 5, Taxa Summary Legends. The ducks in the barn environment have greater phylum level diversity than those in the aviary environment, including a large proportion of Bacteroidetes. (B) Principal Coordinate Analysis of Weighted UniFrac Distances for aviary and barn studies. Samples are colored by environment and age group of the duck samples—Red, Early-Aviary; Orange, Mid-Aviary; Blue, Late-Aviary; Green, Early-Barn; Yellow, Mid-Barn; Purple, Late-Barn. Analyses were conducted on data rarefied to 10,000 sequencing reads. Axes represent the percent of variation explained by each principal coordinate. Individual ceacal samples from a given time point during the development cycle and environment group together. There is separation between aviary and barn environments, though early time point barn samples are partially intermixed with aviary samples from the mid time point.

