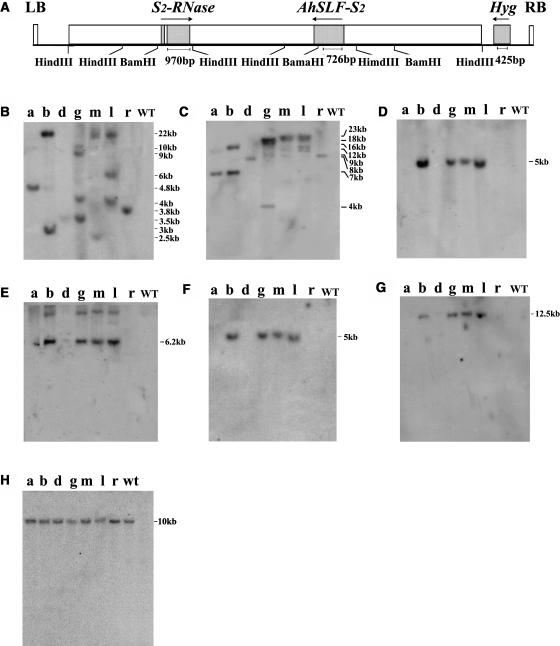
Figure 1.
Molecular Analysis of TAC26 Transgenic Petunia Plants.
(A) A schematic structure of TAC26. Probes for AhS2-RNase and AhSLF-S2 used are also indicated and HindIII and BamHI sites with the genomic region covered by TAC26. LB, left border; RB, right border of the T-DNA; Hyg, hygromycin resistance gene.
(B) to (G) DNA gel blot analysis of the T0 transgenic lines a, b, d, g, m, l, r, and the untransformed control (WT). Leaf DNA (5 μg) was digested with HindIII ([B], [D], and [F]) or BamHI ([C], [E], and [G]) and was blotted and probed with the Hyg fragment ([B] and [C]), AhSLF-S2 ([D] and [E]) and S2-RNase ([F] and [G]).
(H) DNA gel blot of HindIII-digested leaf DNA was probed with a PhS3-RNase cDNA fragment.
Sizes of the markers ([B] and [C]) and the hybridizing bands ([D] to [H]) are indicated in kilobase pairs.

