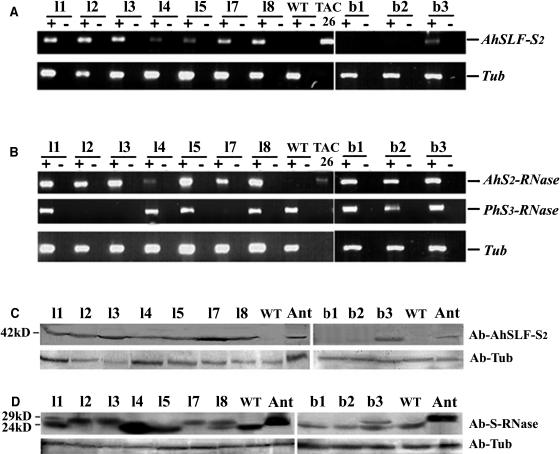
Figure 4.
Expression Analysis of AhSLF-S2 and AhS2-RNase in the Transgenic Petunia T1 Progeny.
(A) and (B) RT-PCR analysis of RNA isolated from pollen or style, with (+) or without (−) reverse transcriptase in the synthesis of cDNA.
(A) Top panel, RT-PCR analysis of RNA isolated from pollen of the transgenic T1 lines l1, 2, 3, 4, 5, 7, and 8, lines b1 to 3, and wild-type plant using AhSLF-S2–specific primers with TAC26 plasmid as a positive control. Bottom panel, RT-PCR analysis of tubulin for loading control.
(B) Top panel, RT-PCR analysis of RNA isolated from styles of the transgenic progeny using AhS2-RNase–specific primers. Middle panel, RT-PCR analysis of RNA isolated from styles of the transgenic progeny using specific primers of PhS3-RNase. Bottom panel, RT-PCR analysis of tubulin for loading control.
(C) and (D) Immunoblot detection of AhSLF-S2 or S-RNases.
(C) Top panel, detection of AhSLF-S2 from total pollen proteins of the transgenic lines l1 to 5, 7, and 8, b1 to 3, wild-type plant, and Antirrhinum (Ant) by polyclonal antibody against AhSLF-S2. The bottom panel is tubulin for loading control.
(D) Top panel, detection of AhS2-RNase (∼29 kD) and endogenous S3-RNase (∼24 kD) from total style proteins of the transgenic lines l1 to 5, 7, and 8, b1 to 3, wild-type plant, and Antirrhinum (Ant) by polyclonal antibody against S-RNases. Bottom panel, detection of tubulin for loading control.

