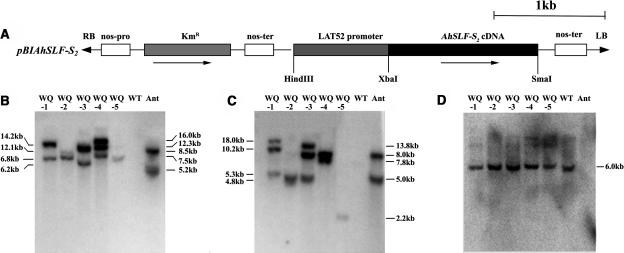
Figure 5.
Molecular Analysis of AhSLF-S2 Transgenic Petunia Plants.
(A) A schematic diagram of pBIAhSLF-S2. RB and LB, right and left borders of the T-DNA; Kmr, kanamycin resistance (neomycin phosphortransferase) gene. Several restriction sites also are indicated.
(B) and (C) DNA gel blot analysis of the transgenic lines WQ-1, WQ-2, WQ-3, WQ-4, and WQ-5 and the untransformed control (WT). Leaf genomic DNA was digested with HindIII (B) or EcoRI (C) was blotted and probed with AhSLF-S2. Leaf DNA of an S2S4 Antirrhinum line (Ant) was as a positive control.
(D) Leaf DNA digested by EcoRI from the transgenic lines was blotted and probed with PhS3-RNase.

