FIGURE 5.
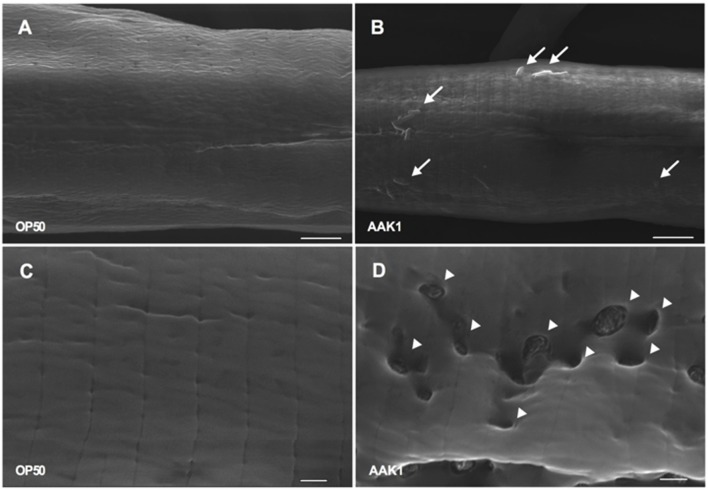
Scanning electron microscopic analysis. Features of N2 animals infected with A. dhakensis AAK1 (right panels, B,D) and control E. coli OP50 (left panels, A,C) for 48 h (upper panels) and 72 h (lower panels) observed by scanning electron microscopy. At 48 h, AAK1 cells that had adhered to animal surface are indicated by arrows (B). Uneven surface and punctate lesions caused by invasion of AAK1 are indicated by arrowheads at 72 h (D). Scale bars in the upper panel indicate 5 μm, and those in the lower panel indicate 1 μm.

