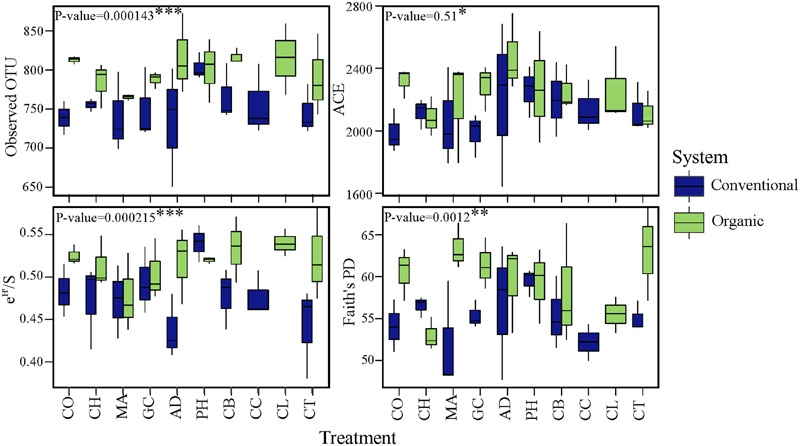
FIGURE 2.

Effects of farming systems and Soil Health Treatments (AD, anaerobic soil disinfestation; CC, chemical control; CL, caliente control; CH, chitin; CB, combination; CO, compost; CT, control treatment; GC, grass-clover; MA, Marigold; PH, physical control) on bacterial community α-diversities. On the boxplots, the center lines show the medians, the bottom and upper limits indicate the 25th and 75th percentiles and the whiskers extend 1.5 times the interquartile range from the 25th and 75th percentiles. The values for each diversity index are showed on y-axis and STHs on x-axis. The significance of the effect of farming systems based on two-way ANOVA on α-diversities.
