
FIGURE 4.
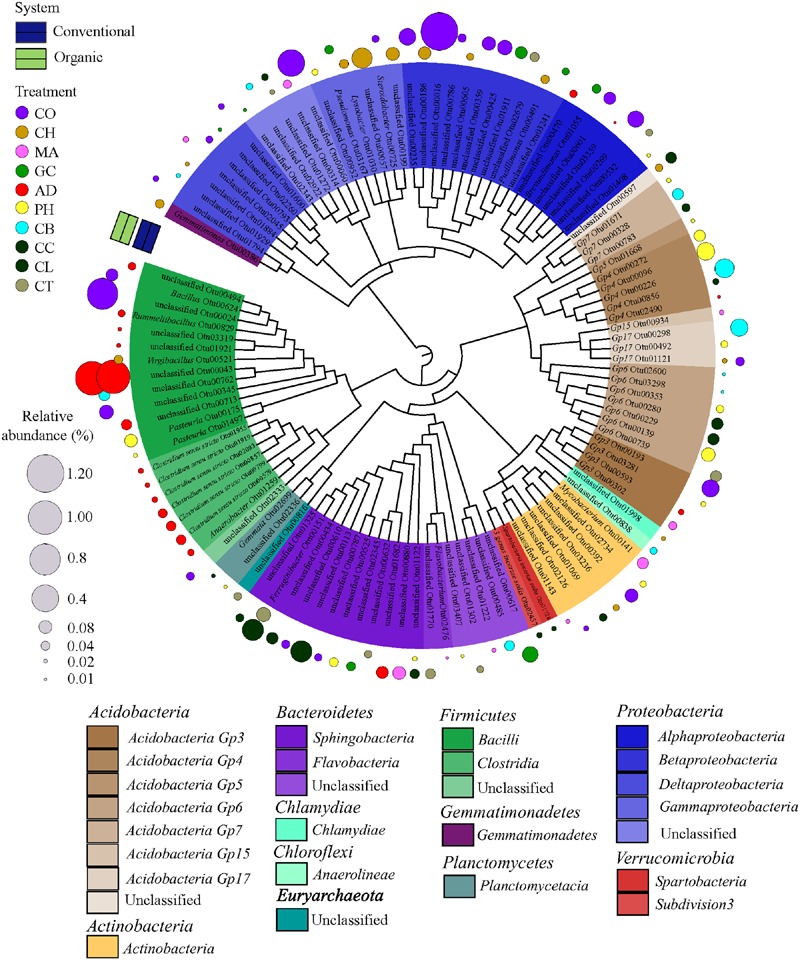
Dendrogram showing the taxonomy and the habitat specialists associated with soil health treatments (AD, anaerobic soil disinfestation; CC, chemical control; CL, caliente control; CH, chitin; CB, combination; CO, compost; CT, control treatment; GC, grass-clover; MA, Marigold; PH, physical control). Only the strict specialist OTUs – cut-off 97% – (9.2% of the total OTU data) with statistical significance of the association (P < 0.05, P < 0.01, and P < 0.001) were considered. The taxonomic affiliation at class level of different Phyla of each specialist OTU is identified by the colors range in the below panel and within the tree. The habits preference for a given OTU is indicated in circles outside of the tree. The SHTs within farming systems (conventional is represented by blue and organic by green colors). The diameter of the circles represents the relative abundance (square-root transformed) of the species. Detailed information on abundance of each OTU is provided in Supplementary Material 2.