FIGURE 3.

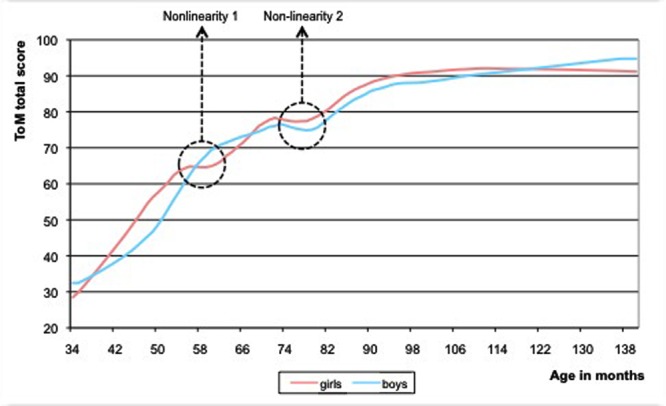
Loess curves of the ToM sum-scores plotted versus age, for boys (black line) and girls (gray line). The girls show two non-linearities, the boys only one.

Loess curves of the ToM sum-scores plotted versus age, for boys (black line) and girls (gray line). The girls show two non-linearities, the boys only one.