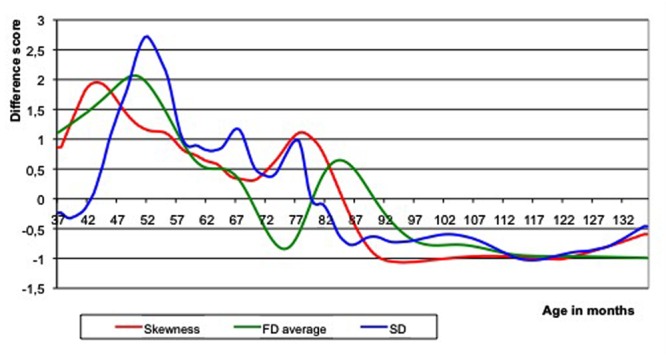
FIGURE 4.

Loess curves of the three qualitative indicators of developmental transition based on empirical data. A mixture between a two-step and a three-step growth process is obvious. There are two peaks, both in the skewness and in the first derivative curve. FD, first derivative (or growth rate); SD, standard deviation (or variability).
