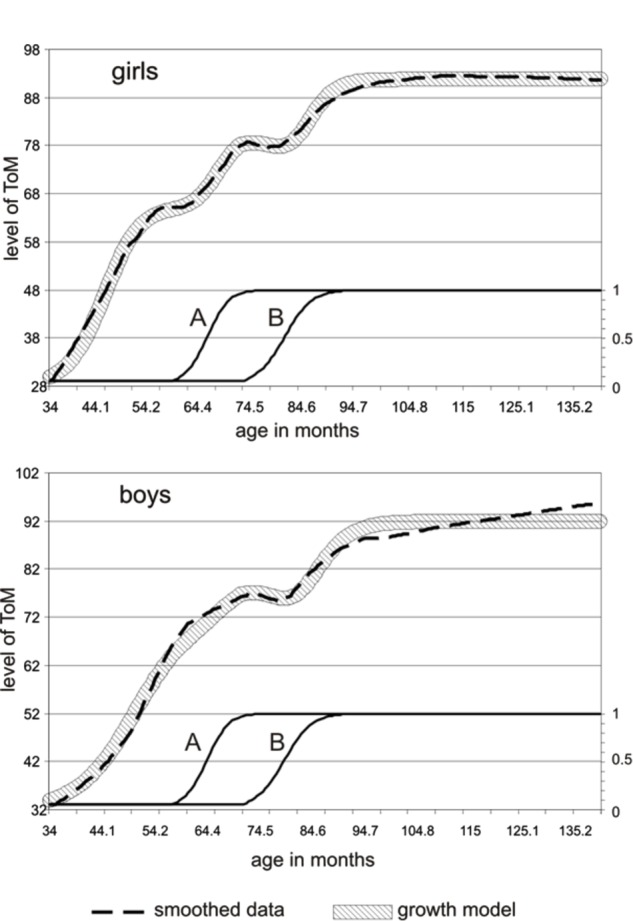
FIGURE 5.

A three-step growth pattern (broad striped line) fitted over the smoothed ToM sum-score data (interrupted line), taking into account the emergence of two underlying, supportive variables A and B. The top graph shows the fit of girls, the bottom part shows the fit of boys. The underlying variables A and B are of the same magnitude and occur at the same age in both genders.
