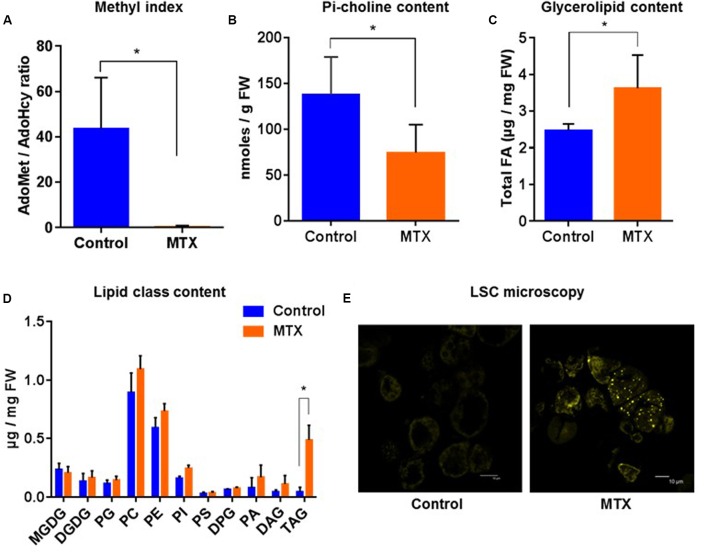
FIGURE 3.
Pi-choline content, methyl index, and lipid analysis of A. thaliana cells incubated 72 h in the presence of MTX. (A) AdoMet/AdoHcy ratio. (B) Pi-choline concentration. (C) Total glycerolipid content expressed as μg of FA per mg of fresh weight. (D) Quantitative analysis of the various glycerolipids (expressed as μg of FA per mg of fresh weight). (E) Nile-Red staining and LSC microscopy imaging showing an accumulation of lipid droplets in MTX treated cells. All the measurements were made after 72 h of treatment. The data are means ± SD of five independent biological repeats for each condition. Significant differences (P < 0.05) are shown by an asterisk and were calculated by an unpaired multiple t-test using GraphPad Prism software.

