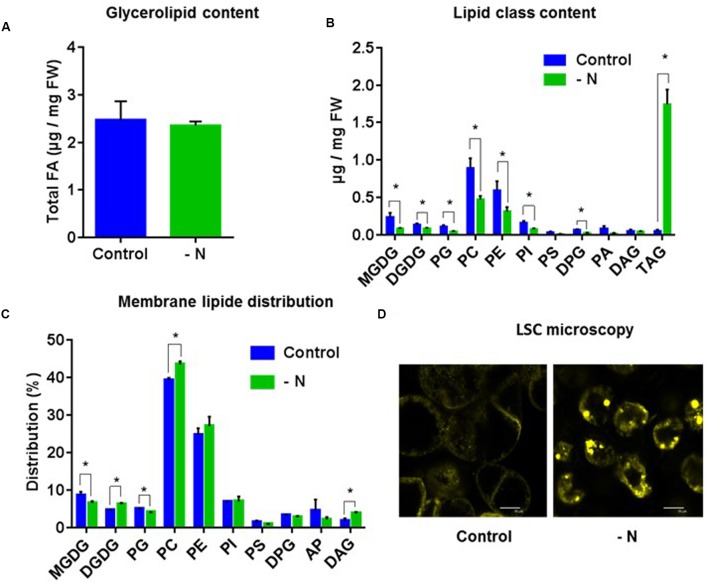
FIGURE 5.
Lipid analysis of A. thaliana cells grown under nitrogen limiting conditions for 72 h. (A) Total glycerolipid content expressed as μg of FA per mg of fresh weight. (B) Quantitative analysis of the various glycerolipids (expressed as μg of FA per mg of fresh weight). (C) Membrane lipid distribution: all glycerolipids except TAG. (D) Nile-Red staining and LSC microscopy imaging showing an accumulation of lipid droplets in MTX treated cells. The data are means ± SD of three independent biological repeats. Significant differences (P < 0.05) are shown by an asterisk and were calculated by an unpaired multiple t-test using GraphPad Prism software.

