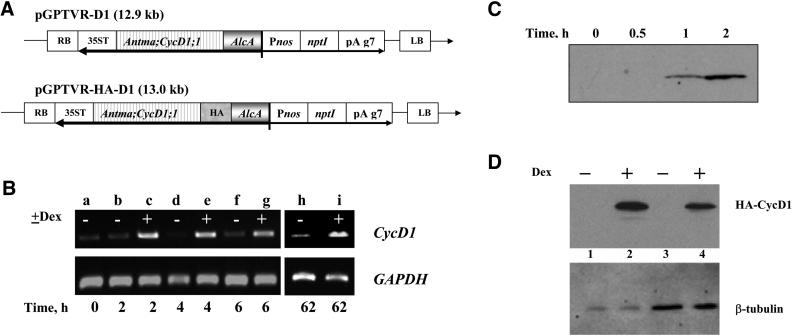
Figure 2.
Inducible Expression of CycD1 in BY-2 Cells.
(A) Inducible cassettes used for transformation. The T-DNA regions of pGPTVR-D1 and pGPTVR-HA-D1 are illustrated. LB, left border; RB, right border.
(B) Time course of CycD1 mRNA expression monitored by RT-PCR, compared with constitutive expression of GAPDH used as loading control. A stationary culture was simultaneously diluted by fresh media and induced (except the control flask) by adding Dex (time = 0). Lane a, culture at time zero; lanes b, d, f, and h, noninduced culture (marked by “−”); lanes c, e, g, and i, induced culture (marked by “+”). Time after induction is shown in hours.
(C) Time course of HA:CycD1 protein expression assessed by protein gel blot with anti-HA antibody. A 4-d-old culture was induced by 10 μM Dex at time 0, and samples were taken as indicated. Equal amounts of protein from induced samples for each time point were loaded on a gel and blotted.
(D) Protein gel blot with anti-HA antibody for two transgenic lines induced by 10 μM Dex for 24 h. Equal amounts were loaded for pairs of induced/noninduced samples, as verified by subsequent blotting with anti β-tubulin antibody. Lane 1, line K 2.3 control; lane 2, line K 2.3 + Dex; lane 3, line K7 control; lane 4, line K7 + Dex.

