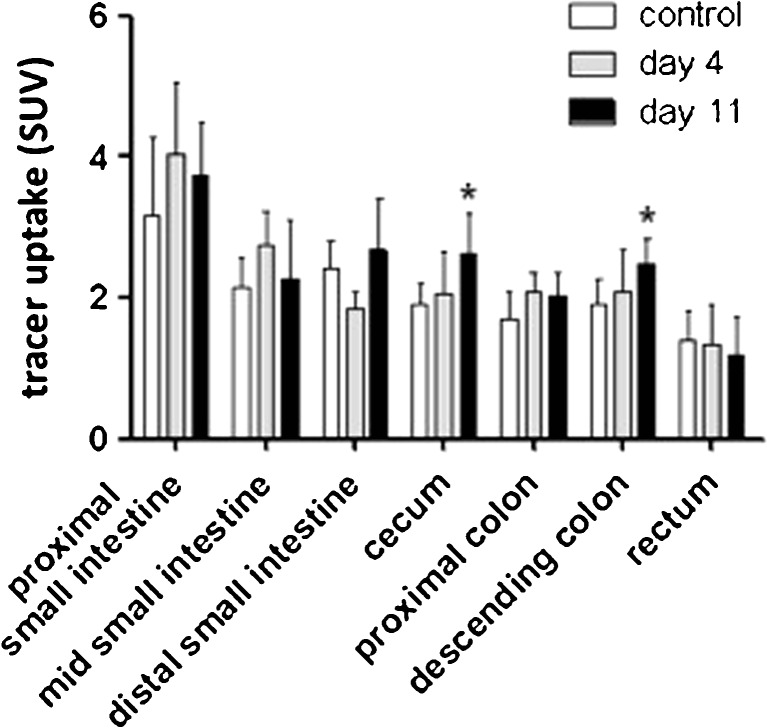
Fig. 4.
Ex vivo Biodistribution of the intestines as a function of disease progression. [11C]PRB28 uptake (60 min) in the intestines of control rats (n = 6) and TNBS-treated rats sacrificed at day 4 (n = 6) and day 11 (n = 6). Data are presented as mean ± standard deviation. Statistically significant differences between TNBS-treated animals and the control group are indicated with an asterisk: *p < 0.05 (ANOVA with Dunnett post hoc test).

