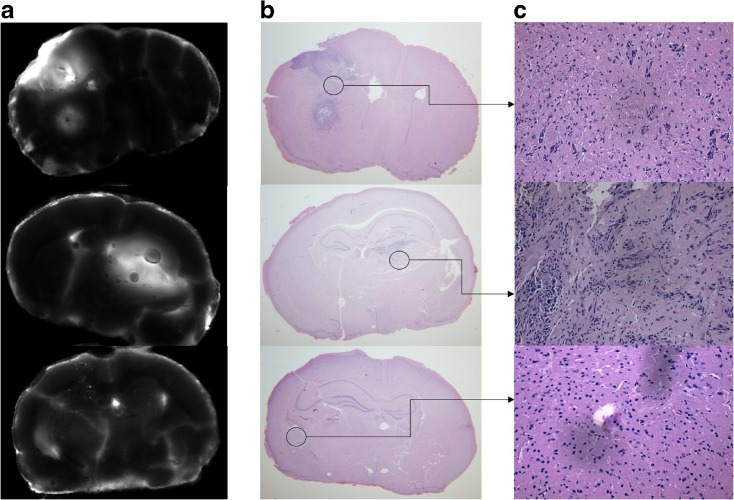
Fig. 3.
These images represent the presence of fluorescent (EGFR) tumor cells at the margin of the primary tumor mass. a Ex vivo fluorescence analysis. b H&E staining (×0.6 magnification). c H&E staining (×10 magnification) and visualization of tumor cells migrating into normal brain tissue. The last row corresponds to sham surgery and, therefore, serves as a control brain tissue.

