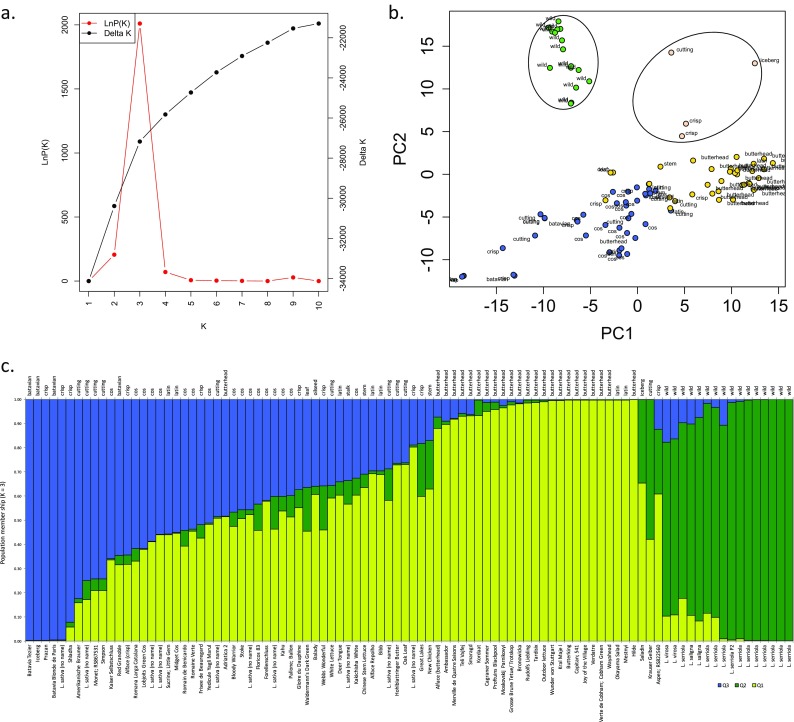
Fig. 3.

Population structure in the lettuce DS. a ΔK and mean LnP(K) derived from STRUCTURE output; K = 3 was chosen as the optimal K value. b Plot of first two eigenvectors from principal component analysis. Three sub-populations are coloured: green wild species, salmon: distinct sub-clade. Remaining domesticates are divided into yellow: Butterhead-like, blue: remaining accessions, predominantly Cos/Romaine types. c Bar plot of sub-population membership when K = 3 (Q1, Q2, Q3). Vertical bar segments are proportional to values of Q which together equal 1.0 (Σk q k = 1). Bars labeled by lettuce name (primary x-axis, bottom) and lettuce crop type (secondary x-axis, top)
