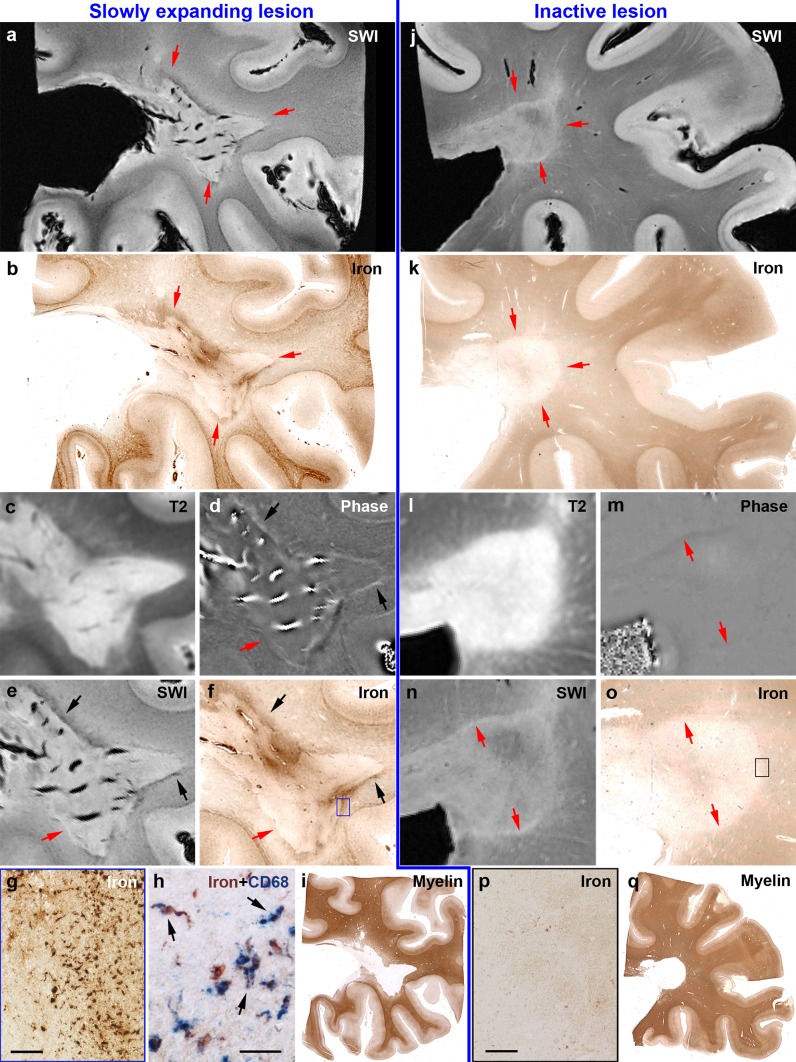
Fig. 4.
Post-mortem validation of SWI and underlying phase images at 7 T for the sensitive and specific detection of iron rims around MS lesions. Left a Slowly expanding rim lesion (red arrows) of PPMS case 26 with hypointense portions along the lesion edge around a hyperintense lesion center. b Corresponding iron staining confirms iron accumulation at the lesion edge (red arrows). c Extent of the hyperintense lesion in the T2 image. Black arrows in (d, e, f) highlight portions of edge-related hyperintense phase and hypointense SWI, which correspond to iron accumulation. Red arrows in (d, e, f) highlight portions which lack hyperintense phase, hypointense SWI and iron accumulation. f The blue rectangle is magnified in (g) and shows iron-laden microglia/macrophages, which is confirmed by double-labeling with the microglia/macrophage marker CD68 (h). Arrows indicate double-labelled microglia/macrophages. i Extent of the demyelinated lesion in PLP staining for myelin. Right j inactive lesion (red arrows in j, k) of PPMS case 27 without edge-related hypointensities around the hyperintense lesion center. k Corresponding iron staining confirms lack of edge-related iron accumulation. l Extent of the hyperintense lesion in the T2 image. Red arrows in (m, n, o) indicate lesion edge devoid of hyperintense phase, hypointense SWI, and iron accumulation. o Black rectangle is magnified in (p), showing the absence of iron-loaded microglia/macrophages. q Extent of the demyelinated lesion in PLP staining for myelin. Scale bars = 100 µm (g, p) and 30 µm (h)

